
How to Look Up Monterey County Jail Population Data
Monterey County publishes operational population details on the Sheriff's Jail Operations Division page, the Sheriff's annual reports, and the Board of Supervisors budget documents. Statewide and national context comes from BJS jail inmate reports, Vera Institute county-level data, and the Prison Policy Initiative California profile. Each source uses a different reporting period, so headline numbers across sources can vary. The Sheriff's own operational figure ("approximately 1,100 incarcerated persons across 31 housing units") is the most current official statement.
Below is the Sheriff's Jail Operations Division page, the primary local source for capacity and program detail.
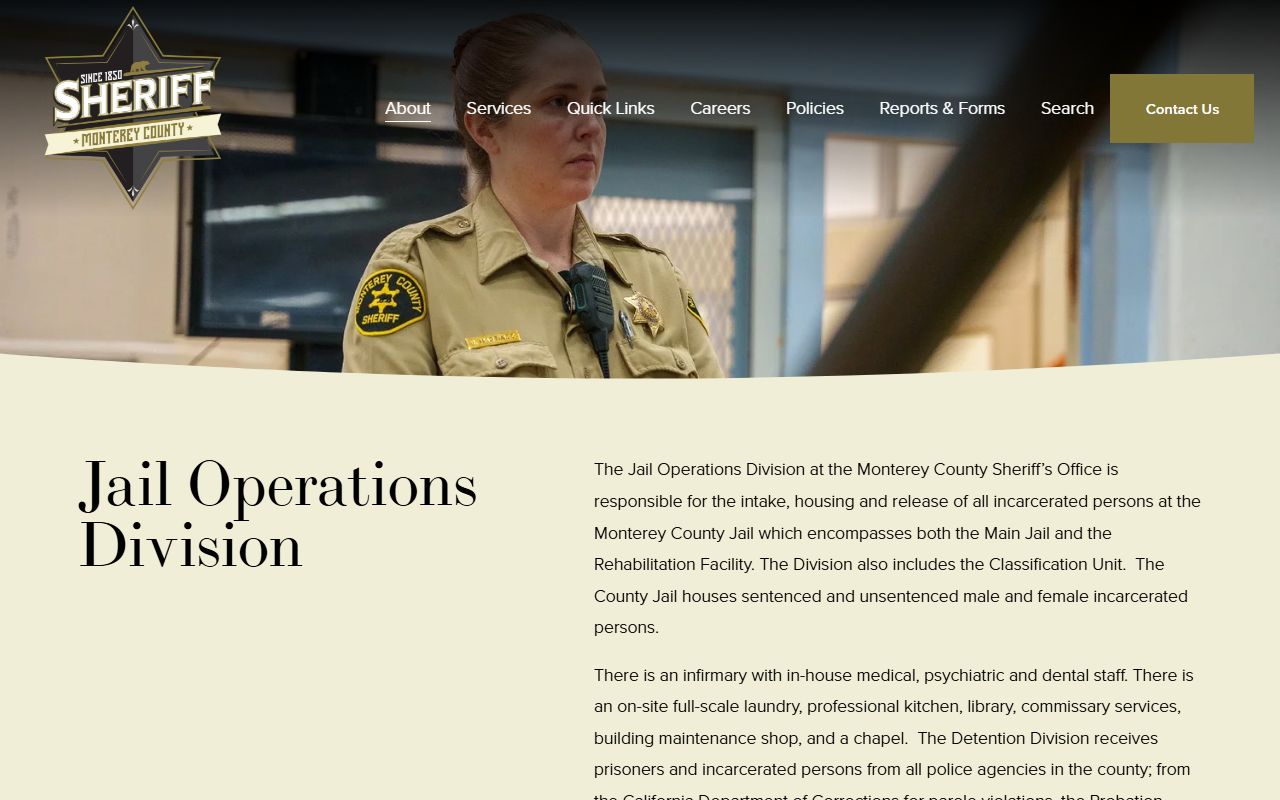
The page lists Main Jail and Rehabilitation Facility capabilities, intake, classification, medical, programs, and the 1,100 / 31 housing-unit figure used across this page.
Monterey County Jail Capacity Overview
The campus at 1414 Natividad Road runs as a single integrated facility under Jail Operations, with the Main Jail and the Rehabilitation Facility sharing intake, classification, medical, and programs. The Sheriff About page sizes the wider agency at 324 sworn deputies, 165 civilian staff, and a $166M annual budget. The corrections healthcare contract awarded in November 2025 funds medical, dental, mental-health, and Jail-Based Competency Treatment services at $139M over five years and five months.
| Facility | Population | Notes |
|---|---|---|
| Main Jail + Rehabilitation Facility (campus) | ~1,100 incarcerated persons | 31 housing units, single cells to open dormitories. |
| Main Jail | Not separately published | Intake, housing, release, classification, infirmary. |
| Rehabilitation Facility | Not separately published | Included in campus count; sentenced inmate programming. |
The official Sheriff source does not split the 1,100 figure between Main Jail and Rehabilitation Facility. Year-by-year average-daily-population (ADP) and demographic detail are not published in the Sheriff's web pages; the Sheriff's annual report and BJS county jail reports are the better source for that historical data.
Average Daily Population
Average daily population is the average count of people in custody on any given day across a reporting period. BJS publishes annual jail inmate reports that estimate ADP at the county level. Vera's Incarceration Trends shows county ADP trends and rates per 100,000. The Sheriff's annual report (linked from the Sheriff site) gives the most direct Monterey-specific number. For a static reference point, the Sheriff's operational statement of approximately 1,100 incarcerated persons is consistent with the campus ADP range published in recent county budgets.
Note: ADP changes month to month with court activity, jail booking trends, and program transitions; use the most recent Sheriff annual report for a current Monterey ADP figure.
Demographic Breakdown
The Sheriff site does not publish a race-and-sex demographic breakdown of current custody. BJS Census of Jails and Vera county-level data provide demographic snapshots on a multi-year basis. The Prison Policy Initiative California profile shows statewide jail demographics, including racial disparities common across California counties. Use those sources alongside the Sheriff annual report for a Monterey-specific demographic view.
The Sheriff's operational notes say sentenced and unsentenced male and female incarcerated persons are housed together at the campus, with women's housing organized through dedicated dorms and blocks. Sentenced people live in open dormitories and may work crews; unsentenced people are held in secured housing and do not participate in work crews.
Pretrial vs Sentenced Population
California jails hold both pretrial detainees (unsentenced) and people serving sentences. The Sheriff's housing model splits these populations because security needs and program access differ. Realignment under AB 109 also placed certain longer state-level sentences in county jails. The Sheriff has not published a current pretrial-vs-sentenced ratio on its public pages; the Sheriff annual report and BJS county jail reports are the right place to confirm a current ratio.
| Group | Housing | Programs |
|---|---|---|
| Unsentenced (pretrial) | Secured housing | No work crews; religious services and library access. |
| Sentenced | Open dormitories or secure housing | Education, vocational classes, drug/alcohol programs, work crews. |
Misdemeanor vs Felony Population
Most pretrial detainees in the Monterey County Jail face misdemeanor or felony charges filed in Superior Court. Felony cases go to Departments 2-6 at Salinas; misdemeanor cases go to Departments 7-11. Misdemeanor arraignment runs in Department 11. The Sheriff site does not publish a current misdemeanor-vs-felony split, but the Superior Court annual statistics and the Sheriff annual report can show the rough proportion. After sentencing, longer state-level felony commitments serve in CDCR rather than the county jail; see the released inmates page for CDCR custody.
Mental Health and Medical Population
The Jail Operations page lists an infirmary with in-house medical, psychiatric, and dental staff. The corrections healthcare partner announced in November 2025 funds medical, dental, mental-health, and Jail-Based Competency Treatment services across the campus under a five-year, $139M contract. Mental-health caseload at the campus is significant; Department 10 at Salinas runs a Criminal Mental Health calendar that includes diversion and competency proceedings under Penal Code 1370.1. Department 13 runs LPS conservatorships and CARE Court at the Monterey Courthouse.
National and State Context
National and state context for Monterey jail data comes from a small set of authoritative sources. The Bureau of Justice Statistics publishes the Annual Survey of Jails and the Census of Jails, both of which list county-level ADP, admissions, releases, and demographic breakdowns. Vera Institute's Incarceration Trends dashboard shows county-level rates per 100,000. The Prison Policy Initiative California profile gives statewide and racial-disparity context.
| Source | What It Provides |
|---|---|
| BJS | Annual jail and prison statistics; county-level estimates. |
| Vera Incarceration Trends | County-level ADP trends, rates per 100,000. |
| Prison Policy Initiative CA | Statewide context and racial-disparity data. |
| Sheriff Annual Report | Local ADP, admissions, releases, program participation. |
Population Trends Over Time
Statewide California jail population dropped after AB 109 realignment in 2011 but has since fluctuated with bail reform, COVID-era release practices, and changes in misdemeanor filings. Monterey-specific year-by-year trends come from the Sheriff annual report and Board of Supervisors budget documents. The Vera dashboard reports county ADP trends in five-year increments, which is the cleanest external view for long-run change. The Sheriff's mention of 1,100 incarcerated persons across 31 housing units is the most current operational statement of campus population.
2025 Correctional Healthcare Contract
On November 18, 2025, the Sheriff announced Correctional Healthcare Partners (CHP Monterey) as the new correctional healthcare provider for the Monterey County Jail. The Board of Supervisors approved a five-year, five-month contract worth $139 million. The contract covers medical, dental, mental-health, and Jail-Based Competency Treatment services. The size of the contract gives an external view of the jail's healthcare population: roughly $25 million a year is committed to in-custody medical, dental, mental-health, and competency-restoration services for an average campus population around 1,100.
The Jail-Based Competency Treatment (JBCT) piece is unusual. JBCT serves defendants found incompetent to stand trial under Penal Code 1370 or 1370.1, allowing competency restoration inside the jail rather than at a state hospital. Department 10 at Salinas runs the criminal mental-health calendar that ties into JBCT eligibility, drug court, DUI treatment court, and veterans treatment court.
Programs and Work Crews
The Jail Operations page lists educational and vocational classes, religious services, library services, and drug and alcohol programs as standard offerings for sentenced inmates. Sentenced inmates may live in open dormitories and work crews; unsentenced inmates are kept in secured housing and do not participate in work crews. More than 250 volunteers support the programs across the campus. Religious services are routinely held in the campus chapel.
The Jail Re-Entry Resource Center, opened October 23, 2025, connects pre-release and recently released inmates with housing, workforce, behavioral health, and other community resources. See the released inmates page for the reentry workflow.
County, State, and National Rate Comparison
Jail incarceration rates are usually expressed as people per 100,000 residents. Monterey County has a population of roughly 437,000, so a campus average daily population around 1,100 places the rate in the same general band as the California statewide jail rate. The Prison Policy Initiative California profile reports a statewide pretrial population around 47,000 across all counties, with significant racial disparity. BJS national jail data places the national jail rate near 220 per 100,000.
| Geography | Source | Rate / Note |
|---|---|---|
| Monterey County campus | Sheriff Jail Operations | ~1,100 in custody on the campus across 31 housing units. |
| California statewide jails | Prison Policy Initiative CA profile | Statewide jail population in low six figures; rate varies by county. |
| U.S. nationwide | BJS Census of Jails | National jail rate near 220 per 100,000. |
Numbers shift year over year. The Sheriff annual report is the right Monterey-specific source for trend work. Vera Incarceration Trends shows county-level ADP rate trends. The Prison Policy Initiative profile shows statewide racial-disparity breakdowns relevant to Monterey demographics.
Searching for Monterey County Inmate Records by Name
This page is population data. For an individual inmate, use the in-custody log instead. The Sheriff's In Custody Log is the public lookup for current inmates and is described in detail on the Monterey County inmate records page. For someone no longer on the log, see the released inmates page for VINELink, CDCR CIRIS, and BOP options.
Sheriff Agency Scale and Budget Context
The Sheriff About page sizes the agency at 324 sworn deputies, 165 civilian staff, and a $166M annual budget. Three primary bureaus run the work: Administrative Operations, Corrections Operations, and Enforcement Operations. Sheriff-Coroner Tina M. Nieto was sworn in December 30, 2022, with 34 years of law-enforcement experience and prior service as Marina Police Chief. She is the first Latina sheriff in California history.
Late 2025 brought a budget squeeze. The Sheriff announced closure of Monterey and King City substation lobby services effective November 17, 2025, after $5.8M in cuts and reassignment of records personnel to Salinas. The change concentrated public-records help at the Salinas headquarters and pushed more inmate-records work through the In Custody Log and the central jail public line at (831) 755-3782. For Sheriff CPRA requests see the public records page; for court calendars at the Salinas Courthouse see court dockets; for warrant lookups, see warrant records.
Where the Data Comes From
Monterey-specific population numbers come from the Sheriff's Jail Operations page, Sheriff annual reports, and the county budget process. Healthcare and capacity context comes from Sheriff press releases. Statewide and national context comes from BJS, Vera, and Prison Policy Initiative. The Monterey County District Attorney's office adds prosecution context through its official page, which lists prosecution categories, collaborative courts, and specialty units relevant to jail population composition.